Outline
- What does it mean to treat each outlet as a weekly-tracked “portfolio bet”?
- Which numbers should define “healthy” for an outlet—before you argue about rent?
- How do you calculate breakeven in a way that actually guides decisions week to week?
- How sensitive is the outlet to rent—and how do you stress-test it before renewal time?
- How do you model manpower like a controllable variable instead of a constant headache?
- How do you separate launch hype from sustainable demand—before you commit to more outlets?
- When should you hold, fix, consolidate, or exit—and how do you decide without ego?
- What does a 14–30 day turnaround sprint look like when costs are the problem?
- How do you budget for consolidation or closure without damaging the core brand?
- How should founders set up weekly reporting so the numbers are trusted—and used?
- Conclusion
- Want a weekly outlet reporting pack your team will actually use?
- FAQs
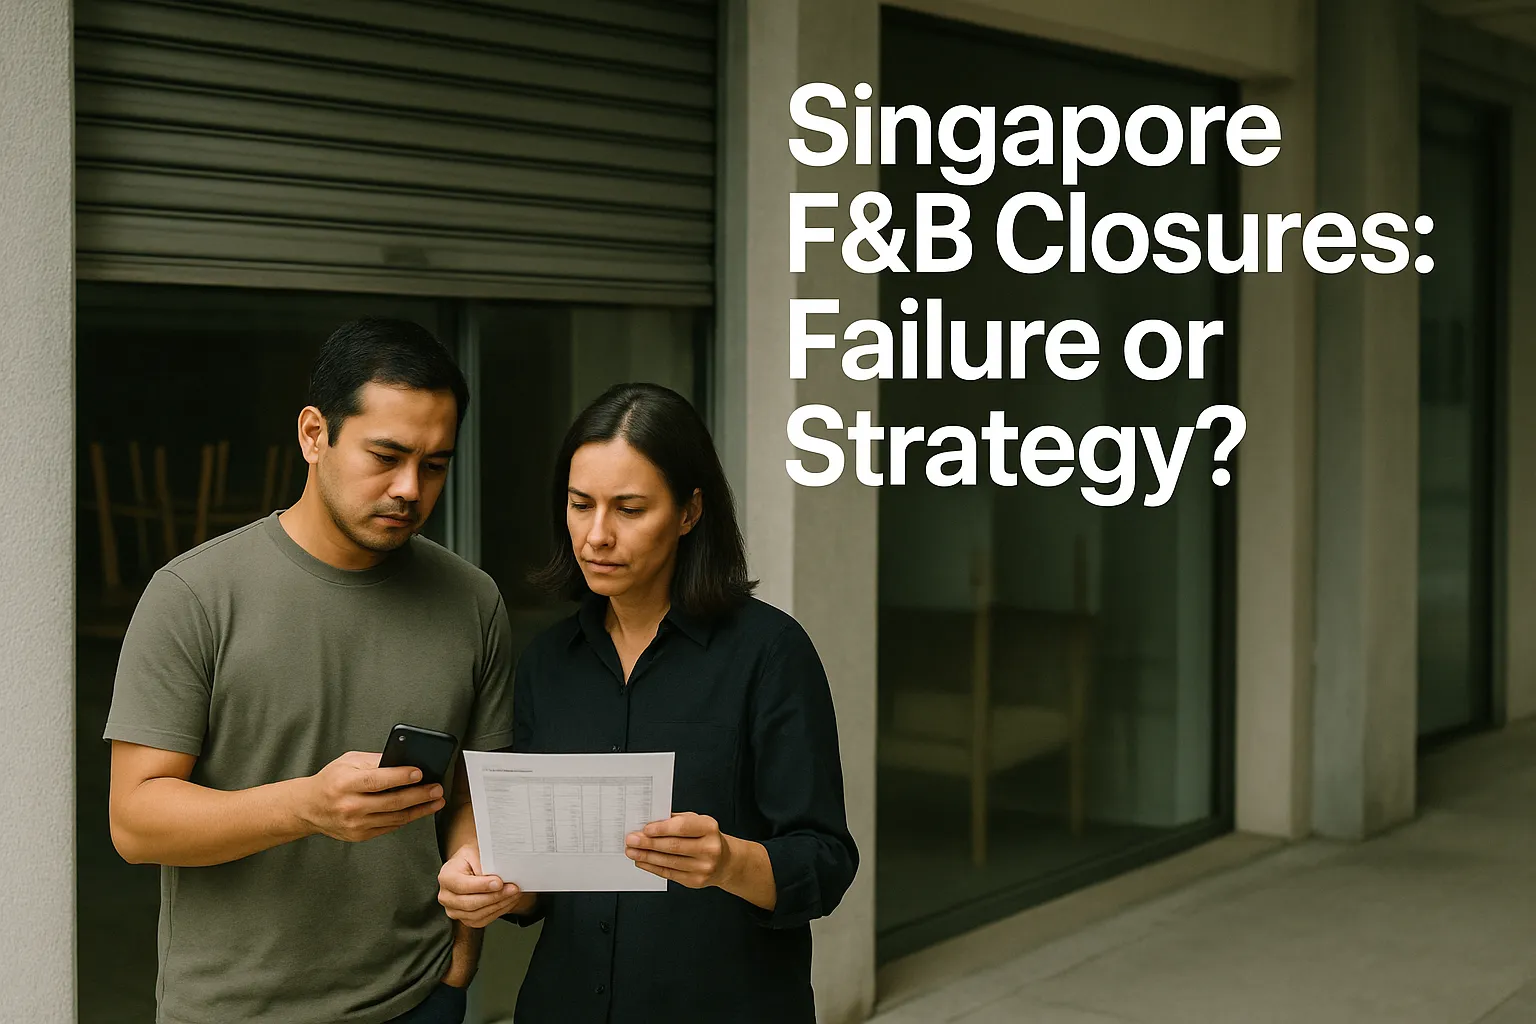
Singapore F&B closures are often framed as “rent too high” or “market too crowded”. For operators, the real issue is cost timing: whether each outlet can survive the next rent review, wage step-up, and post-launch demand decay without draining the parent company. In 2026 heading into 2027, hype cycles are shorter, customer acquisition costs are more volatile, and labour scheduling mistakes get punished fast.
This guide treats every outlet as a weekly-tracked portfolio bet. You’ll learn how to measure contribution margin and prime cost, stress-test rent and manpower sensitivity, and set decision thresholds for hold/scale/exit. The goal is not to avoid closures at all costs—but to exit or consolidate early, preserve brand/IP, and keep the core business healthy.
What does it mean to treat each outlet as a weekly-tracked “portfolio bet”?
If you run multiple outlets (or plan to), the fastest way to get blindsided is to manage them like one blended business. Blended reporting hides weak locations until cash is gone.
Treating outlets as a portfolio means:
- Each outlet has its own weekly P&L “heartbeat” (sales, prime cost, rent, and controllable overhead).
- You assume some outlets are experiments (higher volatility) and some are core (protect at all costs).
- You make pre-committed decisions using thresholds (not feelings) when the data turns.
A practical definition of “weekly unit economics”
For weekly tracking, you want metrics that are:
- Available quickly (within 48–72 hours after week end)
- Hard to manipulate
- Actionable by operators (not just finance)
Minimum weekly dashboard per outlet:
- Revenue: total, dine-in vs delivery, average ticket
- Contribution margin (after COGS and direct labour)
- Prime cost: COGS + labour (in $ and % of sales)
- Rent ratio: rent (fixed + estimated GTO) as % of sales
- Sales per labour hour (SPLH)
- Breakeven sales for that outlet (weekly)
Why weekly (not monthly) matters in Singapore
In a high-fixed-cost city, a bad month is often preceded by 2–3 bad weeks. Weekly tracking lets you:
- Adjust staffing and menus before losses compound
- Detect demand decay after launch spikes
- Plan earlier for lease renewal conversations
The portfolio mindset also reduces ego. Closing an outlet that fails its thresholds is not “giving up”; it’s redeploying capital and management attention to the outlets that can win.
Which numbers should define “healthy” for an outlet—before you argue about rent?
Operators often start with rent because it’s the loudest bill. But rent is only fatal when prime cost and productivity are not controlled.
Start with contribution margin, not net profit
For outlet-level decisions, build your waterfall like this:
- Sales
- Less COGS (food + beverage packaging where relevant)
- Less direct labour (kitchen + service + outlet manager on roster)
1. Contribution margin
- Less rent (fixed + service charge + realistic GTO estimate)
- Less outlet operating costs (utilities, cleaning, POS, smallwares, pest control)
2. Outlet operating profit (before head office)
Why this helps:
- Contribution margin tells you whether the outlet’s core model works.
- Rent then becomes a “capacity cost” you can stress-test.
Prime cost as the non-negotiable discipline
Prime cost = COGS + labour. It is where most outlets bleed.
Use prime cost for operational control because:
- Menu engineering affects COGS quickly.
- Scheduling and role design affect labour quickly.
Practical control targets vary by concept, but you should still set internal bands such as:
- “Green” band: prime cost within target range
- “Amber” band: requires weekly action plan
- “Red” band: triggers escalation (GM/owner review and a 14–30 day turnaround sprint)
Sales per labour hour (SPLH) is the bridge between ops and finance
SPLH = Sales / total labour hours.
Track it weekly because it tells you:
- Whether roster matches traffic reality
- Whether service model is too manpower-heavy
- Whether you’re paying for idle time (a silent killer when wages rise)
If two outlets have the same sales but one runs 20% more labour hours, the “problem” is rarely wages—it’s workflow design, prep planning, station coverage, and training consistency.
How do you calculate breakeven in a way that actually guides decisions week to week?
Many teams compute breakeven once, file it away, and keep operating by hope. You want a breakeven model that updates weekly.
Step 1: Separate fixed vs variable costs (at outlet level)
Fixed (mostly):
- Base rent, service charge
- Minimum utilities baseline
- Fixed subscriptions tied to the outlet
Variable/semi-variable:
- COGS
- Labour (variable if you schedule well; fixed if you don’t)
- Delivery platform commissions
Step 2: Use contribution margin ratio (CM%)
CM% = (Sales – COGS – direct labour) / Sales.
Then:
- Weekly breakeven sales = Fixed costs / CM%
This is more useful than net margin because it focuses on what you can change quickly.
Step 3: Translate breakeven sales into traffic and ticket size
Founders make better decisions when breakeven is expressed as:
- Customers per day, or
- Orders per hour during peak periods
Example structure (illustrative, not a benchmark):
- If weekly fixed costs are $18k and CM% is 35%, breakeven sales ≈ $51k/week.
- If average ticket is $25, you need ~2,040 tickets/week (~290/day).
Now you can ask operational questions:
- Is that traffic realistic for the location?
- Can the kitchen and front-of-house handle that volume without quality drop?
- If not, should you redesign the model (raise ticket, improve CM%, or reduce fixed costs)?
Decision use
Breakeven is not just a “finance” number. It triggers actions:
- If you’re below breakeven for 3 consecutive weeks: you need a corrective plan.
- If you’re below breakeven and the next rent step-up is imminent: you need an exit/consolidation scenario, not just marketing spend.
How sensitive is the outlet to rent—and how do you stress-test it before renewal time?
Rent isn’t only “high”; it’s often fragile because of step-ups, GTO clauses, and renewal uncertainty.
Build a rent sensitivity table (simple, powerful)
For each outlet, model weekly profit under rent changes:
- Current rent
- +10%
- +20%
- +30%
Then add sales scenarios:
- Current sales
- -10% sales (post-hype normalisation)
- -20% sales (competitive entry / demand shift)
You’re looking for the “cliff”—the point where a small change flips the outlet from survivable to cash-draining.
Fixed rent vs GTO (gross turnover) isn’t just a landlord negotiation detail
- Fixed rent: predictable, but punishing when demand drops.
- GTO rent: can protect downside but often comes with higher effective rent when you succeed; also requires clean sales reporting and can create disputes if systems are messy.
Operational implication: if your POS and channel sales tracking aren’t tight (dine-in vs delivery vs promos), you increase friction and risk during rent reconciliation.
Step-up clauses: plan for them like wage increments
If the lease includes step-ups, treat them as scheduled cost shocks. Add them into your 12–18 month outlet forecast.
A practical control:
- 6 months before the step-up, run a “cost-offset plan”:
- Menu price architecture refresh (not blanket price hikes)
- Portion control and yield management
- Labour model adjustment (see manpower section)
Lease renewal risk: avoid negotiating from desperation
If you wait until the last minute:
- You negotiate with weak leverage
- You accept terms that lock in a bad outlet for another cycle
A better cadence:
- Start renewal scenarios 9–12 months before expiry
- Decide early whether the outlet is “core”, “optional”, or “exit candidate”
Cannibalisation across outlets is a rent problem disguised as growth
When you open near an existing outlet:
- Total brand sales may rise slightly, but per-outlet rent burden rises sharply.
- You may be paying two rents for one demand pool.
Control method:
- Track postcode / catchment patterns (where customers come from)
- Compare same-store sales trends for nearby outlets after a new opening
- If cannibalisation is real, consolidation can be a value-preserving move.
How do you model manpower like a controllable variable instead of a constant headache?
In Singapore, manpower is not just a cost line—it’s a capacity system. When it’s designed poorly, you get both higher payroll and inconsistent service.
Scheduling math: stop rostering by habit
Weekly labour control starts with two numbers:
- Forecast sales by daypart (lunch/dinner/late)
- Target SPLH by daypart
Then you schedule backwards:
- Required labour hours = forecast sales / target SPLH
If your team cannot execute this consistently, your “labour cost problem” is often a forecasting and role clarity problem.
Role design: don’t pay for “floating” ambiguity
Common leakage patterns:
- Too many generalists with overlapping responsibilities
- No clear prep ownership, leading to rush-hour overtime
- Managers doing line work because stations aren’t trained
Practical fix:
- Define stations and standard work (opening, peak, closing)
- Cross-train intentionally (not ad-hoc)
- Assign one person accountable for prep yield and wastage tracking per shift
Reliance on part-timers: cheaper hourly, sometimes costlier overall
Part-timers help flexibility, but there are hidden costs:
- Higher training churn
- Lower consistency during peak hours
- Higher supervision load on seniors
A useful metric:
- Training hours per new hire and training cost per retained employee (30/60/90 days)
If part-timer churn is high, your labour “savings” may be offset by:
- Waste, remakes, comped items
- Slower table turns
- Poor reviews reducing repeat rate
Service consistency is a financial control
Service inconsistency shows up as:
- Lower repeat rate
- Higher refunds/voids
- More discounting to “fix” customer dissatisfaction
Treat training as a cost-control investment:
- 2–3 critical service behaviours (greeting, order accuracy, issue recovery)
- Simple QA checks at shift handover
Where this becomes founder-level: if your concept requires high-touch service to justify pricing, you must budget for the manpower model that delivers it. Otherwise, your brand promise and your cost structure will conflict.

How do you separate launch hype from sustainable demand—before you commit to more outlets?
The 2026–2027 reality is that discovery is shifting: video-first search and AI-driven recommendations can create sudden spikes—and sudden drop-offs. That makes attention easier to get and harder to convert into repeat customers.
The key is cohort tracking, not impressions
If you only track:
- Views, likes, follower count
- Week 1–2 sales spikes
…you will overestimate demand.
Track demand sustainability using cohorts:
- First-time customers acquired in Week X
- How many return in Weeks X+1, X+2, X+4
- Average ticket on return visits
Simple operational method (no heavy tech required):
- Use loyalty sign-ups, QR ordering IDs, or reservation/queue identifiers to tag first-time vs returning
- Review weekly repeat rate and frequency
Non-vanity KPIs that predict whether an outlet can survive
Focus on:
- Repeat rate (30-day returning customers)
- Offer dependency (what % of sales require discounts)
- Channel mix stability (delivery-heavy spikes can vanish)
- Complaint rate / remake rate (quality inconsistency kills repeats)
CAC volatility: budget like it will swing
As traffic sources fragment (platform algorithm changes, influencer cycles), customer acquisition cost (CAC) becomes less stable.
Practical budgeting discipline:
- Set a monthly “paid reach” cap per outlet
- Require post-campaign readouts tied to repeat behaviour, not just footfall
- If a campaign drives traffic but not retention, treat it as a one-off event—not a growth engine
Hype half-life is shorter; your payback window must be shorter
If your outlet requires 9–12 months to “find its base”, you are exposed.
A practical rule of thumb (as a management discipline, not a universal benchmark):
- If the outlet cannot show a stable post-launch run-rate within a defined window (e.g., 8–12 weeks), freeze expansion and diagnose before adding complexity.
Expansion should be earned by repeatable unit economics—not by a strong opening week.
When should you hold, fix, consolidate, or exit—and how do you decide without ego?
Closures aren’t always failure. The failure is letting a weak outlet drain cash and leadership bandwidth until it hurts the whole group.
Use a four-box decision framework (review weekly, decide monthly)
1) Hold (core performer):
- Contribution margin healthy
- Stable repeat behaviour
- Rent sensitivity acceptable
Action: protect service quality, keep staff, cautious optimisation.
2) Fix (turnaround candidate):
- Contribution margin workable, but labour/COGS control poor
- Demand exists, operations inconsistent
Action: 14–30 day sprint with clear owner and targets.
3) Consolidate (brand-level optimisation):
- Two outlets cannibalising
- Same staff pool stretched thin
- One location clearly stronger
Action: merge demand into best site; preserve brand/IP; redeploy team.
4) Exit (capital preservation):
- Below breakeven with no credible path
- Lease terms create a cost cliff
- Repeat rate weak; promos needed to stay afloat
Action: planned closure that protects reputation and cash.
Pre-commit to thresholds
To remove emotion, define triggers such as:
- X consecutive weeks below breakeven
- Prime cost above target for Y weeks without improvement
- Rent ratio above a maximum at “normalised” sales
- Repeat rate below a minimum despite service fixes
The exact thresholds depend on your concept, but the principle is consistent: write them down and use them.
Remember the portfolio goal
The goal is not “every outlet must live.” The goal is:
- the group stays solvent
- the brand remains trusted
- the team remains stable
- capital is redeployed to higher-return units
What does a 14–30 day turnaround sprint look like when costs are the problem?
Turnarounds fail when they are vague (“sell more”, “cut costs”) instead of structured.
Week 1: Diagnose and stop the bleeding
Owner: Ops lead + finance partner
- Validate numbers (POS vs bank deposits, delivery payouts, voids/discounts)
- Identify top 10 menu items by sales and margin
- Check wastage and yield (portion control, prep loss)
- Review roster vs traffic; cut idle hours immediately
Deliverable: a one-page “leak map” with 3–5 actions.
Week 2: Implement controllable fixes
Owner: Outlet manager
- Menu engineering adjustments (push high CM items; reduce low-margin complexity)
- Prep plan and station ownership
- Update SOP for peak periods (handover, queue management, order accuracy)
- Retrain on 2–3 service behaviours that protect repeat rate
Deliverable: daily checklist and revised roster template.
Week 3: Price architecture and supplier reality
Owner: Founder/GM + procurement
- Adjust price ladder (entry, core, premium) rather than blanket increases
- Re-negotiate supplier terms where volume justifies it
- Replace “hero” ingredients that cause volatility or wastage
Deliverable: updated recipe costing sheet and margin targets.
Week 4: Decide—don’t drift
Owner: Founder + finance
- Recompute breakeven using updated CM% and labour hours
- Compare to realistic sales run-rate (post-hype)
- Decide: continue, consolidate, or exit
A turnaround sprint is successful even if the decision is closure—because you closed with evidence and preserved the wider business.
How do you budget for consolidation or closure without damaging the core brand?
A closure becomes expensive when it’s reactive. A planned consolidation is a financial and reputational project.
Budget the “exit cost” early (even if you never use it)
For each outlet, maintain an exit budget line that considers:
- Make-good/repair obligations (as per lease terms)
- Inventory run-down plan (minimise wastage)
- Staff redeployment or notice costs
- Vendor settlement plan
- Marketing/comms to redirect customers to other outlets
This is not a legal checklist—it’s cost planning so you can act quickly when the numbers turn.
Preserve brand/IP value during consolidation
A smart consolidation protects the assets that survive the location:
- Name, recipes, signature items
- Customer database/loyalty relationships
- Operating SOPs and training materials
- Supplier arrangements that support the remaining outlets
Practical playbook:
- Announce “relocation” or “consolidation” where truthful
- Offer migration incentives (e.g., loyalty carry-over) instead of heavy discounting
- Move key staff to the surviving outlet to preserve service quality
Avoid the two common consolidation mistakes
1. Cutting too deep in the surviving outlet
You consolidate to a stronger site, then understaff it to “save costs” and damage repeat rate.
2. Letting cash leakage continue during wind-down
A weak outlet can burn significant cash in its final weeks if rostering and purchasing aren’t tightly controlled.
Keep your reporting honest
During closure periods, teams sometimes mask performance with promos or accounting shortcuts. A simple control:
- Separate “clearance” promos from normal sales reporting
- Track CM% with and without closure-related discounts
If you want consolidation to be a strategic move, your numbers must remain decision-grade.
How should founders set up weekly reporting so the numbers are trusted—and used?
Weekly reporting fails when it’s too slow, too complex, or not owned.
Build a minimum viable “weekly pack”
Per outlet, 1–2 pages maximum:
- Sales summary (by channel)
- COGS and labour in $ and %
- Contribution margin and CM%
- Rent ratio (and upcoming lease milestones)
- SPLH and labour hours
- Breakeven vs actual sales
- Notes: 3 operational issues + 3 actions for next week
Assign owners and deadlines
- Outlet manager: sales notes, staffing, operational issues
- Ops lead/GM: validates operational actions, compares outlets
- Finance: validates numbers, flags variance, maintains sensitivity models
Deadline discipline (example):
- Data close: Monday noon
- Review: Monday/Tuesday
- Actions communicated: Tuesday
Make data quality a control, not an afterthought
Common problems:
- Inconsistent discount coding
- Untracked staff meals
- Delivery platform fees not reconciled
- Cash leakage from voids/refunds
Practical controls:
- Standard discount codes and approval rules
- Weekly reconciliation of delivery payouts to POS sales
- Simple variance checks: if COGS% moves sharply, require explanation within 48 hours
Where Paul Hype Page & Co. can fit (without turning it into a “finance project”)
Some founders want the discipline of weekly packs but don’t want to build a full finance team early. Paul Hype Page & Co. can support the design of outlet-level management reporting, costing templates, and budgeting rhythms—so operators get numbers they trust and can act on, while finance stays aligned with IRAS-ready bookkeeping and clean audit trails where applicable.
Conclusion
In Singapore’s high-cost consumer market, closures can be rational—if they’re the output of disciplined weekly unit economics, not a last-minute cash crisis. Treat each outlet as a portfolio bet: track contribution margin, prime cost, rent ratio, SPLH, and breakeven weekly; stress-test rent step-ups and sales downturns; and watch repeat behaviour so hype doesn’t trick you into over-expansion.
If an outlet can be fixed, run a 14–30 day sprint with measurable targets. If the economics don’t work, consolidate or exit early—while you can still protect staff stability, customer trust, and the brand/IP that should outlive any single location. The founders who win into 2027 aren’t the ones who never close—they’re the ones who close fast, cleanly, and on purpose.
FAQs
At minimum: sales by channel, contribution margin, prime cost (COGS + labour), rent ratio, sales per labour hour (SPLH), and breakeven sales—reviewed within 48–72 hours of week end.
Separate outlet fixed costs from variable costs, compute contribution margin ratio (CM%), then estimate weekly breakeven sales as fixed costs divided by CM%, updating the inputs each week as labour hours and mix change.
When the outlet sits below breakeven without a credible operational fix, faces an upcoming cost cliff from rent or manpower, or relies on discounts with weak repeat behaviour—consolidation can preserve brand/IP and protect the stronger locations.
Contribution margin isolates whether the outlet’s core model works after COGS and direct labour; it makes rent a separate capacity cost you can stress-test instead of guessing from blended net results.
Model profit under rent increases (e.g., +10% to +30%) alongside sales-down scenarios (e.g., -10% to -20%) to find the ‘cliff’ where small changes turn the outlet into a cash drain.
Share This Story, Choose Your Platform!
Related Business Articles